Deep-Dive Spotlights
Flagship Engineering Projects
Comprehensive systems engineered from scratch: complete state machines, custom mathematical scoring, real-time data pipelines, and production UI.
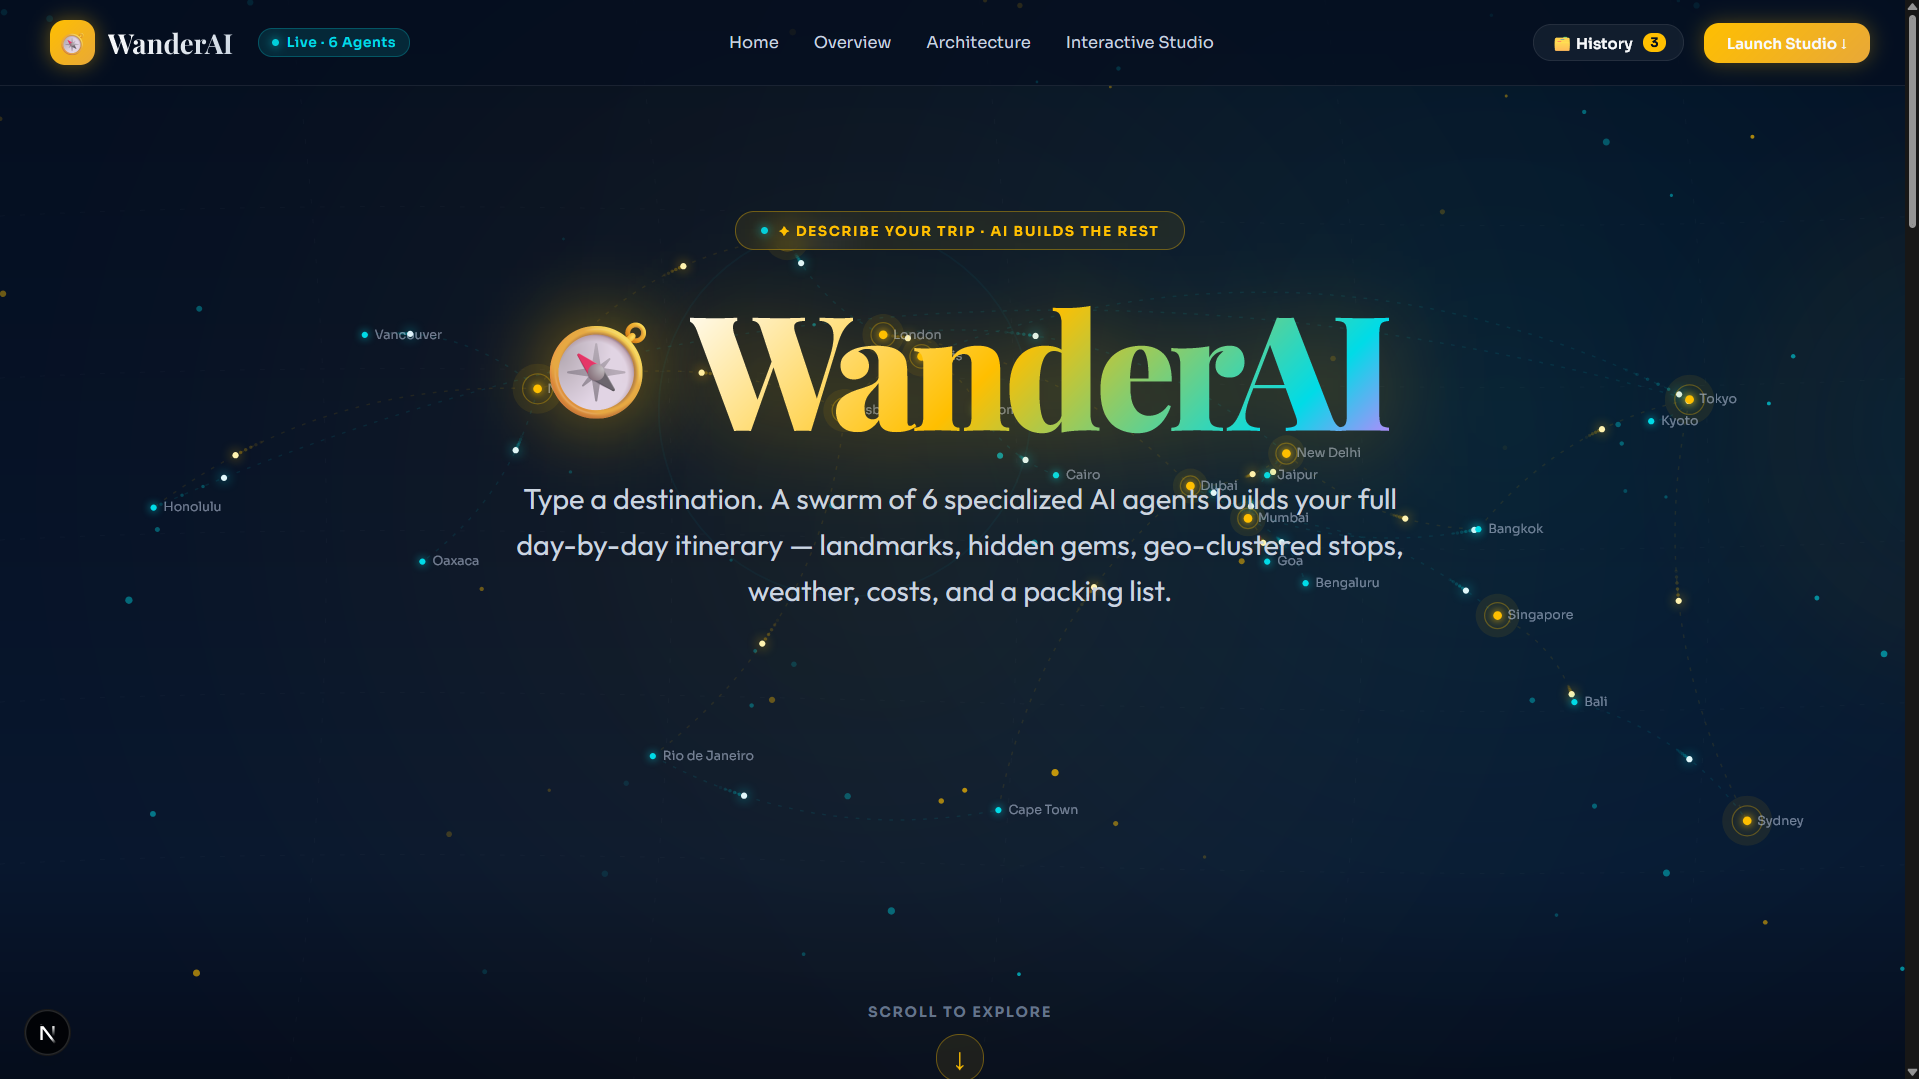
FLAGSHIP SYSTEM 01 · MULTI-AGENT STATE MACHINE
WanderAI — AI Travel Planner
An autonomous multi-agent travel system built with LangGraph and Next.js 16. Resolves spatial disorientation and routing bugs in standard LLMs through K-means++ coordinate clustering, community sentiment analysis, and interactive timeline drag-and-drop editing.
Core Problem:
Standard LLMs generate geographically chaotic routes (causing zig-zag transit), hallucinate closed attractions, and lack persistent state for iterative editing.
Architecture:
4-Agent LangGraph workflow (Intake, Ranker, Planner, Editor) with SQLite checkpoints and dynamic preference clarification.
Custom Engine:
Log-normalized ranking formula balancing Reddit and travel blog sentiment against Google Places review volumes.
Real Data:
K-means++ spatial POI clustering, live Open-Meteo forecasts, and a 4-tier zero-auth Wikipedia photography cascade.
FLAGSHIP SYSTEM 02 · LOCAL-FIRST RAG SYSTEM
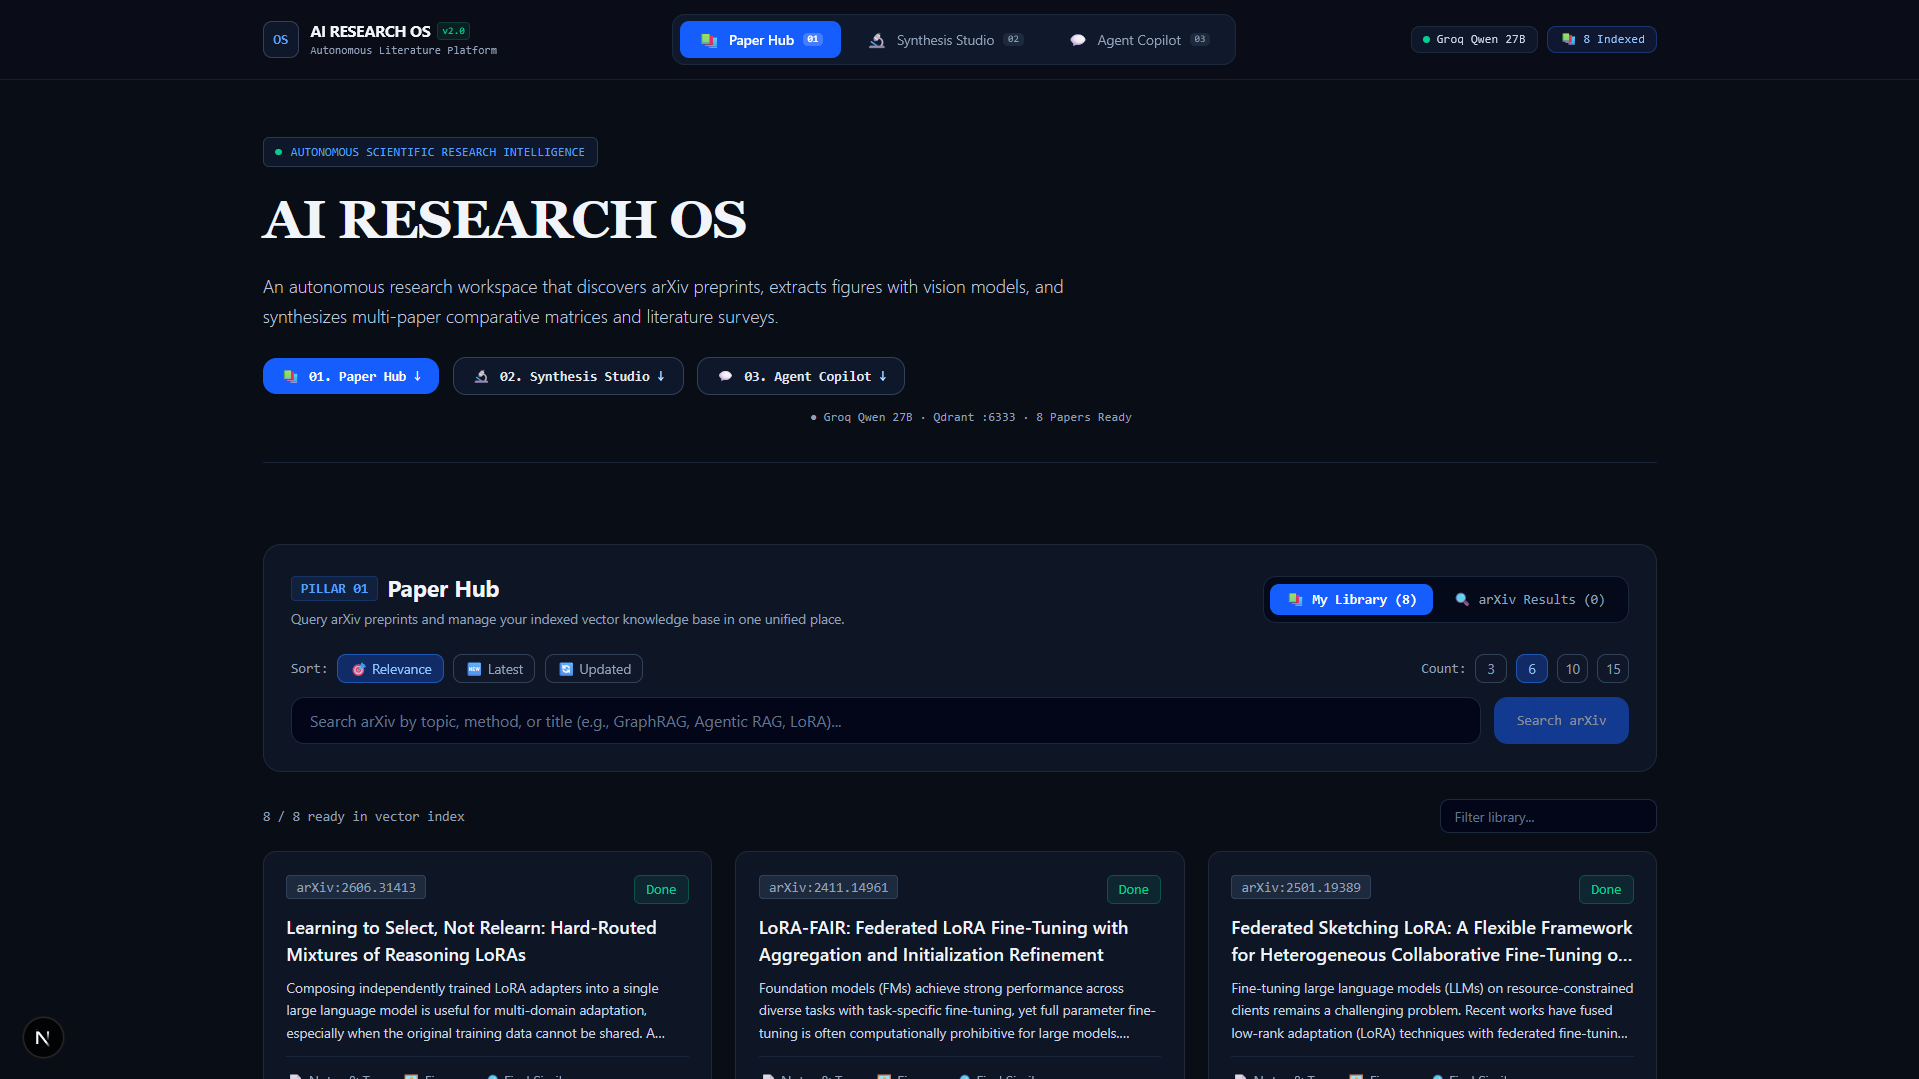
AI Research OS
An end-to-end literature research platform combining arXiv paper discovery, layout-aware PDF parsing, vision models for figure captioning, and multi-agent literature survey synthesis.
Core Problem:
Standard chat models shred complex multi-column academic papers, hallucinate mathematical formulas, and cannot reference visual figures or provide verifiable citations.
Parsing Pipeline:
Docling layout analyzer with local Qwen2.5-VL vision models for extracting and captioning technical figures and tables.
Orchestration:
4-agent cyclic LangGraph team with dual router: local Ollama for background parsing and Groq 70B for real-time synthesis.
Traceability:
Qdrant vector similarity search with Server-Sent Events (SSE) streaming and clickable paragraph-level citation anchors.